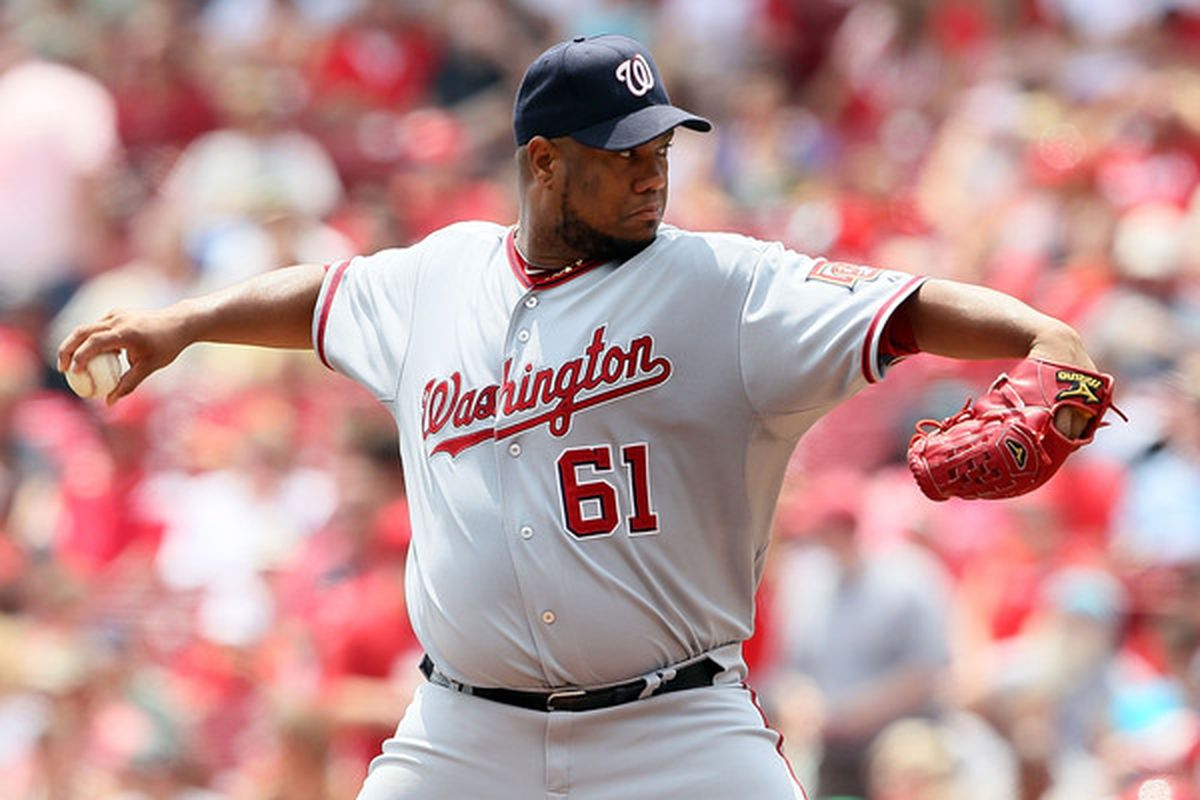
Last year I posted a bunch of articles examining the shapes and sizes of MLB pitchers. It was a fun project but all I can do is look at pitchers based on the avaible data that I have which is merely height, weight, and body mass index. This isn’t a lot to go off of.
So when I came across this research from 2009 that looked at 10+ physical measurements of elite level pitchers in Cuba, I was super excited to see what I could learn.

The first word in the research study was “Kinanthropometry” which is the combination of body composition, somatotype, and proportionality. I’ve written a lot about anthropometrics which would cover the proportionality part of kinanthropometry. To find a new, to me, term and research paper that covers every physical aspect of an athlete is powerful.
The researchers, who have conducted similar studies with world-class athletes in Cuba across various sports, underscore the significance of Kinanthropometry as follows:
“describe an individual’s morphological profile, which serves as a basis for planning and monitoring athletic training”
This is something that I have been preaching for a long time. I’ve even written 180 page e-book on this topic.
The rest of the article is going to explore what they looked at and what they found. I will follow up with another article where I put in my two cents to see how we can use this information to improve our coaching.
The Study (subjects, methods, results)
One hundred players from the 2002-03 season in the Cuban National Baseball Series were used as subjects. Their Mean age was 28.56±5.2 years with 16.45±5.3 years playing baseball. They looked at every position but we will focus on the 20 pitchers who were just under 6 feet tall and weighed just over 190 lbs.
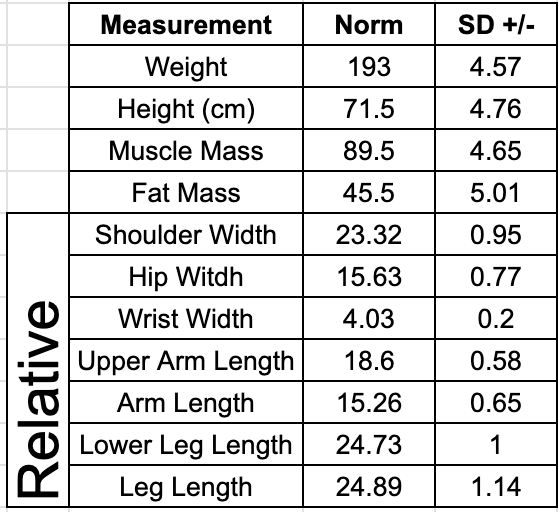
Look at all these awesome physical stats about these pitchers.
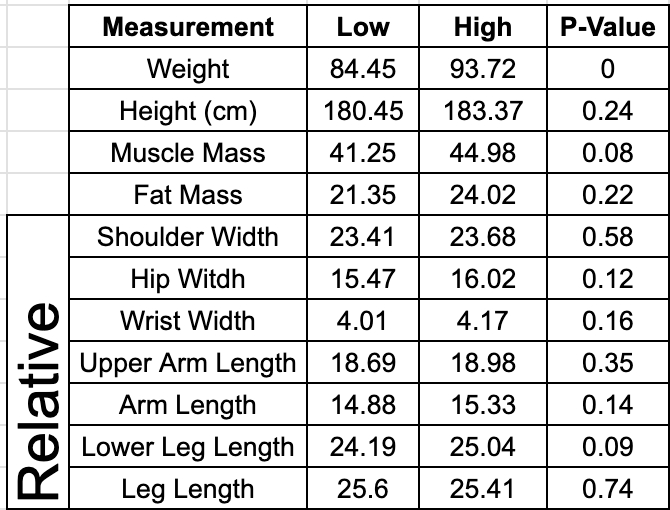
Before we dive into what these numbers mean, let’s talk about how the researchers sorted the 20 pitchers. They split them into two groups based on how often they won games.
Now, we all know that winning isn’t always the best measure of a pitcher’s skill. Just ask Dave Stieb. But despite its flaws, the researchers used it to divide the pitchers into two groups. If a pitcher won more than 60% of their games, they were in the high-performance group. If not, they fell into the low-performance group.
So, when we look at these pitchers based on this grouping, here’s what we find:
Based on these numbers the authors explored the Kinanthropometry of each group. So let’s go through the individual 3 components (proportionality, somatotype, and body composition) that make up my new favorite term, Kinathropometry.
Proportionality
Here’s how the authors describe proportionality:
“Human proportionality describes the relationship between different body dimensions and stature. This is a very important consideration for anyone wishing to practice sports, since this relationship is associated with a person’s physical ability to meet the biomechanical demands of a particular sport or playing position within a given sport. Athletic ability and performance, as well as aptitude for a particular sport, depend greatly on proportionality.”
This is something that I’ve been trying to describe for a while now. These authors did a way better job of making it clear and concise as to why proportionality, or what I’ve been calling anthropometrics, is so vital.
The way they measured proportionality was to compare certain body measurements to the athletes standing height.
Here are the body parts that were measured.
- Upper Arm length
- Arm Length
- Leg Length
- Lower Leg Length
- Wrist Breadth
- Biacromial Breadth (shoulder width)
- Biiliocristal Breadth (hip width)
Here’s a couple of pictures of how you would “officially” measure the last three.
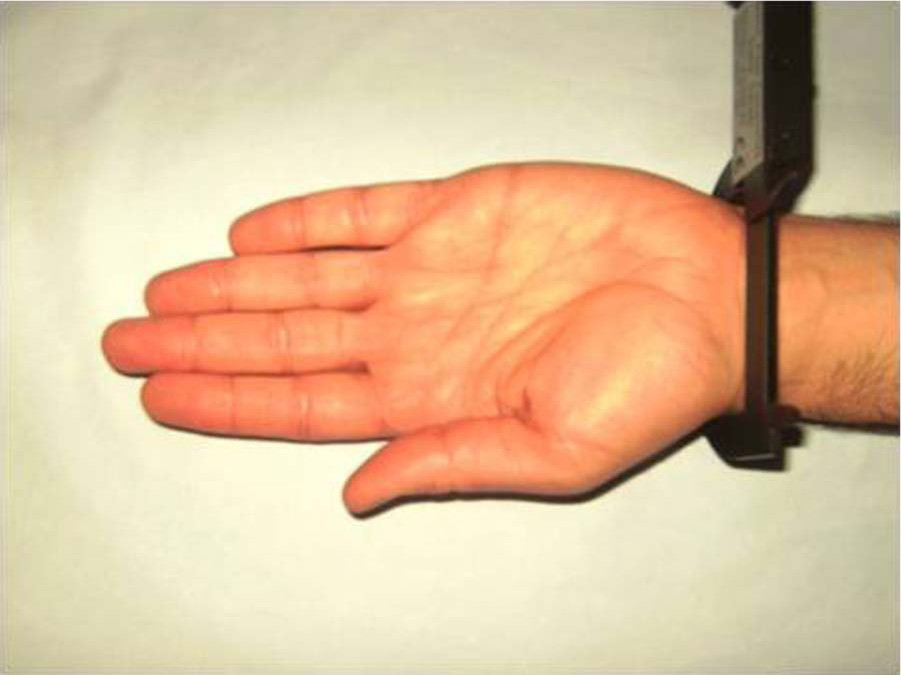
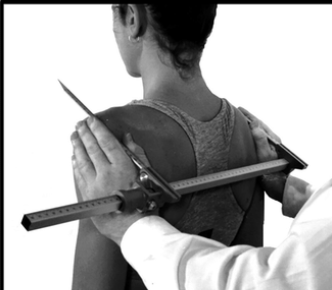
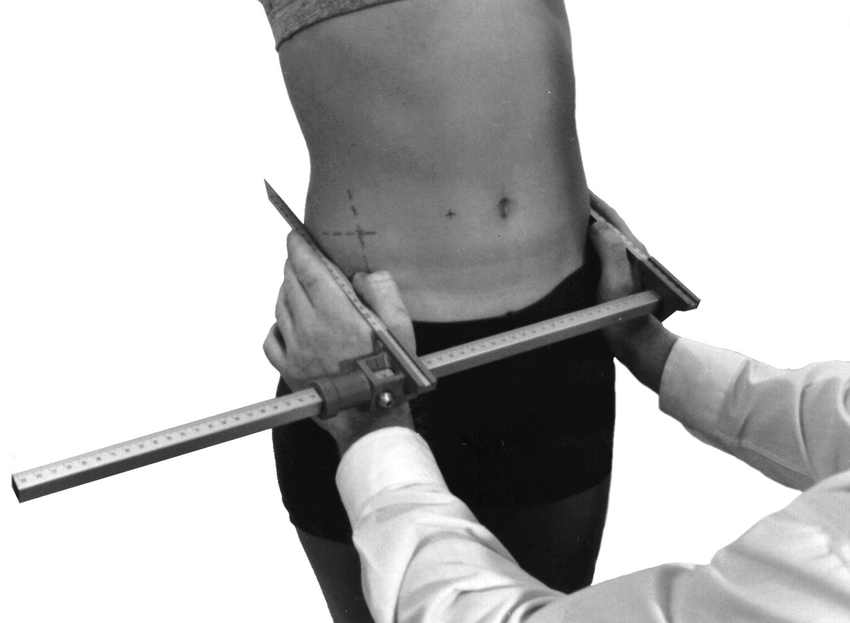
Credit – research gate – Kevin Norton
To get the relative scores of these body parts the following formula was used:
Body Part (cm) x 100/Height
So if you’re 183 cm tall (aka 6 foot) and your biacromial breadth (aka shoulder width) is 45 cm your relative acromial width would be:
45×100/183=24.6
So this means that if you are short and wide, you will have a higher relative score compared to athletes that are tall and narrow. In part 2, I’ll write about how these relative lengths differ from the absolute measurements we get and how they are both important to consider.
The most significant differences between the high and low performance groups from a proportionality stand point was the relative lower leg length and relative hip width.
Somatotype
Most people have been exposed to the three body types that fall under the somatotype classification system and have seen pictures like this:
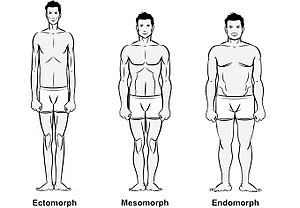
Here are some Big league examples:
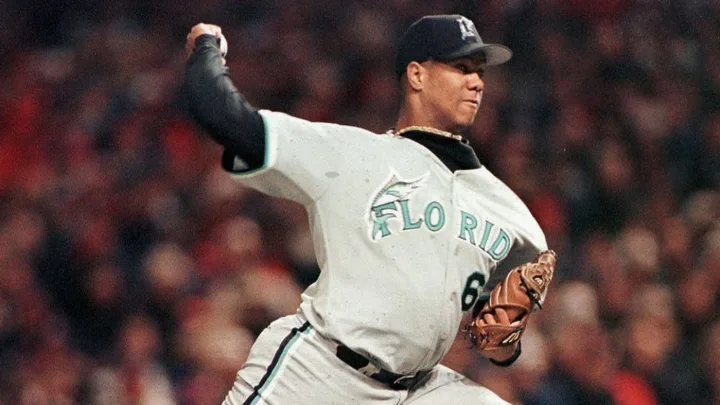
- Ectomorph: Triston Mckenzie
- Mesomorph: Garret Cole
- Endomorph: Alec Monoah
These are extreme examples. There are some pitchers that don’t fit nicely into one category but rather show some traits of two categories, such as a meso-ectomorph. The black dot on this somatotype spectrum would fall under that meso-ectomorph category.
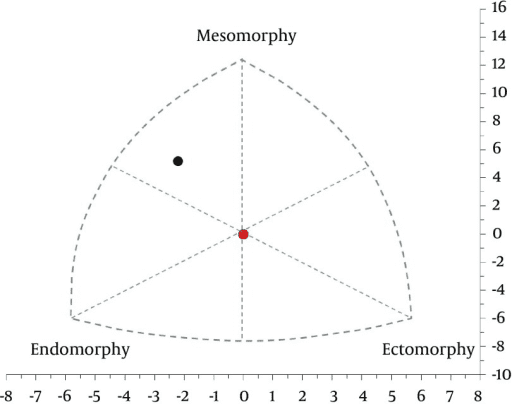
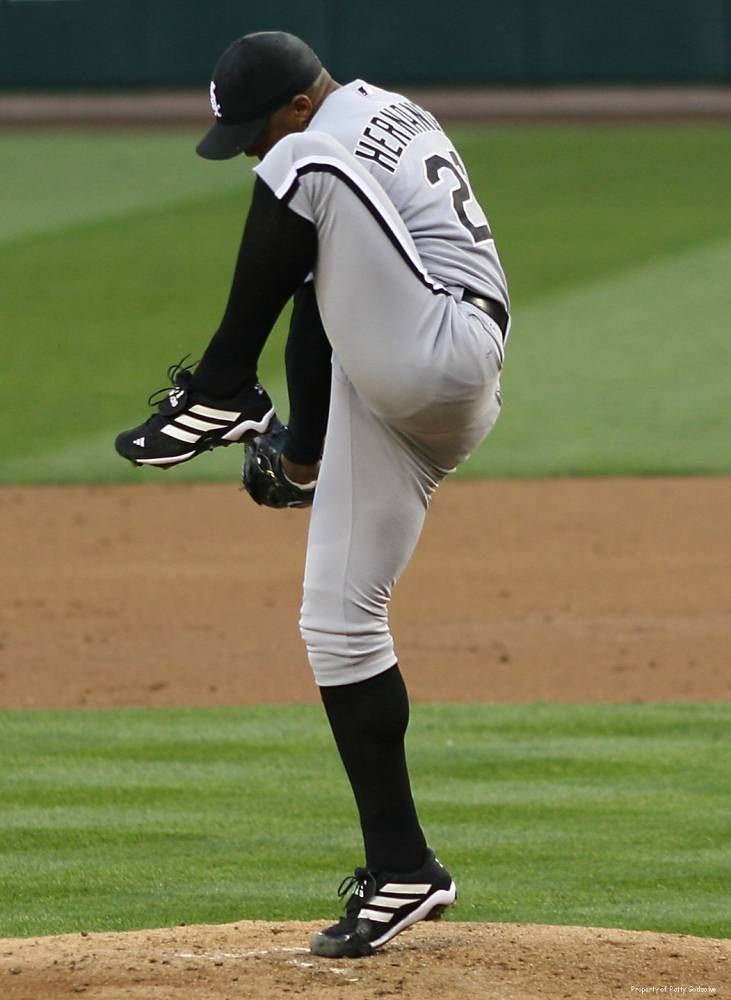
Livan Hernandez, early in his career, might have been a good candidate to fall under this subcategory
Later in his career, he moved more towards the pure endomorph part of the spectrum.
While his brother would be more of a hybrid between the meso and ectomorph making him an ecto-mesomorph. Maybe a bit more ectomorph than mesomorph.
When we look at how these 20 pitchers were classified based on their somatotype we get this:
| Somatotype | Low | High | p-value |
| Endomorphy | 3.18 | 3.5 | 0.49 |
| Mesomorphy | 4.23 | 6.2 | 0.00 |
| Ectomorphy | 1.67 | 1.08 | 0.19 |
To get these numbers, the researchers used what’s called the Heath-Carter method. This uses 3 different formulas, one for each somatotype, to determine just how much a certain athlete demonstrates the characteristics of each somatotype.
These formulas will produce a value between 0 and 7. If an athlete scores between 0 and 2.5 they are considered low in that particular somatotype. Between 3 and 5 is considered moderate and 5 to 7 is labeled as high.
Confusing isn’t it. Let’s look at it this way. If we took Triston McKenzie and used the Ectomorph formula he would score in that high range, let’s say 6.8. Then if we used the formula for mesomorphy he would likely score much lower, let’s say 2.4 and even lower when we look at his endomorphic score, let’s say 0.5.
So we would get 3 scores for each person which then enables us to qualitatively classify athletes.
The formulas are somewhat complicated. Here’s the Mesomorphy calculation for example:
[(0.858 x humerus breadth) + (0.601 x femur breadth) + (0.188 x corrected armgirth) + (0.161 x corrected calf girth)]– (height x 0.131)+ 4.50
For more information check out this video.
Based on the results from this study, the high performance pitchers were much more mesomorphic than the low performance group, to a very significant degree. The same goes for Endomorphic but not to the same extent. The low performance group was more ectomorphic.
Body Composition
When most of us think of body composition we might think of skinfold measurements that give us an estimation of how much muscle and fat make up an athlete’s overall mass.
These researchers used a fancy and complicated body composition formula (Ross-Kerr 5 factor) to get these results
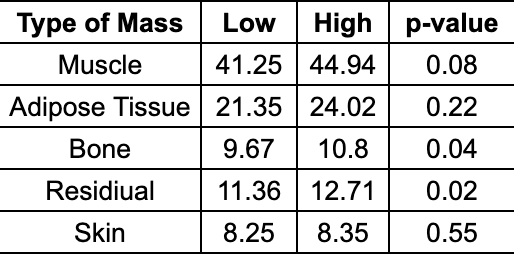
The difference in muscle mass is 3.7 kg or 8.2 lbs which is pretty significant. The exact level of significance is shown under the p-value column (lower = better). What makes the muscle mass difference so significant in my eyes is that it is a type of tissue that we can actively enhance through proper training. Statistically, bone tissue was more significant but training to gain more bone mass is harder. It’s less adaptable than muscle. That being said, the best way to gain bone mass is through training with movements such as sprints and jumps. These high force types of movements place a great deal of stress on the bones, in a good way. Bones adapt just like muscle in that it gets bigger, stronger, and more dense. It’s just a lot slower of a process and I’m not too sure how much it can change once an athlete has reached maturity.
Conclusion
From this information we can say that heavier pitcher’s won more games. So I guess every team should put a BBQ and snack bin in their bullpen.
It’s not as easy as that but it is still awesome to see this kind of data on some of the best pitchers in the world.
Part 2, I’ll take a deep dive into what this information means and how we can use it to our advatange.
Sincerley,
Graeme Lehman, MSc, CSCS

Leave a comment