Kinogram – a simple yet effective tool to improve mechanics

Do you want a simple and low-tech tool that can help any young pitcher improve their delivery? If you answered yes, try making a Kinogram. They are simpley a sequence of pictures taken at specific points in time of, in our case, a pitcher throwing a baseball. The golf world has used them forever. I can remember trying to copy Fred Couples swing from a magazine my dad had lying around the house when I was a kid.

Poetry in Motion

Even in a world where we can get slow-motion bio-mechanical breakdowns with quantifiable kinematic and kinetic data all in your pocket, I still think that an “old-school” Kinogram can help a lot.  Sure it has its limitations which I will point out, but when it comes to pitchers getting information that they can understand with both their developing brains and bodies, I’d put Kinogram’s near the top of my “useful tools” list.  

Here’s what you can expect to learn about Kinograms in this article

  • What’s a Kinogram?
  • Why are Kinogram’s useful?
  • How to make your own Kinogram?
  • What are the limitations of Kinogram’s?

What’s a Kinogram?

The Kinogram has been around since the 1880’s.  That’s right around when baseball was just starting to take off.  It’s how researchers began to study movement when taking still pictures was considered high-tech.

Kinogram’s are NOT a series of pictures taken at regular time intervals.  They are a sequence of pictures taken when an athlete hits a certain mechanical landmarks.

Here are the landmarks I use, I’ll explain each one later

  1. Peak knee lift
  2. Drive Phase (foot under lead hip)
  3. Just Prior to Front Foot Contact
  4. Front Foot Contact
  5. Max External Rotation
  6. Ball Release
  7. Follow Through 

Here’s what Paul Skenes Kinogram at LSU looks like:

I was exposed to the term “Kinograms” when I downloaded an e-book by Stu McMillan and Dan Pfaff from Altis.  These are two of the top track and field coaches in the world.  Their e-book, which I highly recommend, shows you how to build a kinogram for sprinting.  https://altis.world/kinogram-method-ebook/

Why Are Kinogram’s Useful?

The low-tech aspect of a kinogram is exactly what makes it a useful tool.  It’s so low-tech that our caveman brains can understand what we are looking at, the shapes that we want to produce with our bodies to optimally throw a baseball.

Shapes are intuitive and don’t require a deep understanding of pitching mechanics and human anatomy.  We can show a pitcher what they look like at key points of the delivery and let their natural abilities and athleticism decide how they go from point A to point B to point C and so on.  The pictures they’ll see are very informative yet not overwhelming.

If they aren’t making the shapes that we want to see we can compare their kinogram to that of a high level pitcher. We can easily point out the differences that might be holding them back.  It’s like one of those “can you spot 5 differences” kind of pictures we give to young children.

Now I want to take the time to stress that I don’t think every pitcher should try to copy what another pitcher looks like.  This is especially true if you are trying to compare yourself to an MLB pitcher with a completely different body type.  But even if you found a good comparable, your kinogram wouldn’t and shouldn’t look the exact same since there are a lot of different ways to throw a ball really, really, really hard.

WIth that being said there are some biomechanical principles that must be met to achieve elite levels of throwing velocity. Kinogram’s serve as a great screen to identify mechanical inefficiencies, if you know what you’re looking for. This will the topic of a future article.

How to build a Kinogram? 

Building a Kinogram is simple and I recommend that you get the pitchers themselves to build their own following these simple instructions.  This will save you a bunch of time and provide your athlete’s with a deeper understanding of their mechanics.

Take a slow motion video of each pitcher from the side.  The number of frames per second will play a big role in picking your exact picture that you use for each point in the delivery.  For now we will just use this one angle from the side as it’s the easiest for everyone to get on the same page as to exactly when these key points of the delivery happen thus increasing the reliability of this tool.

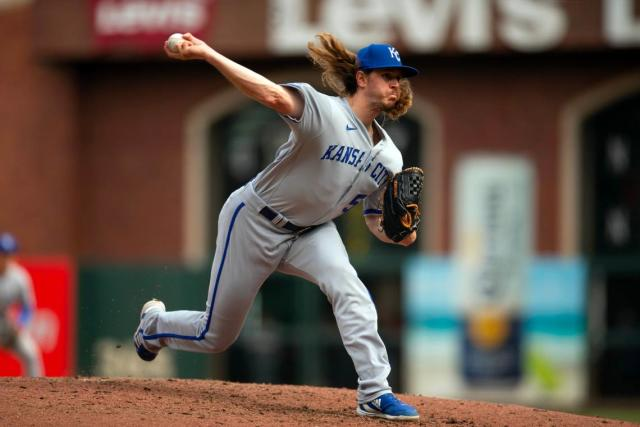
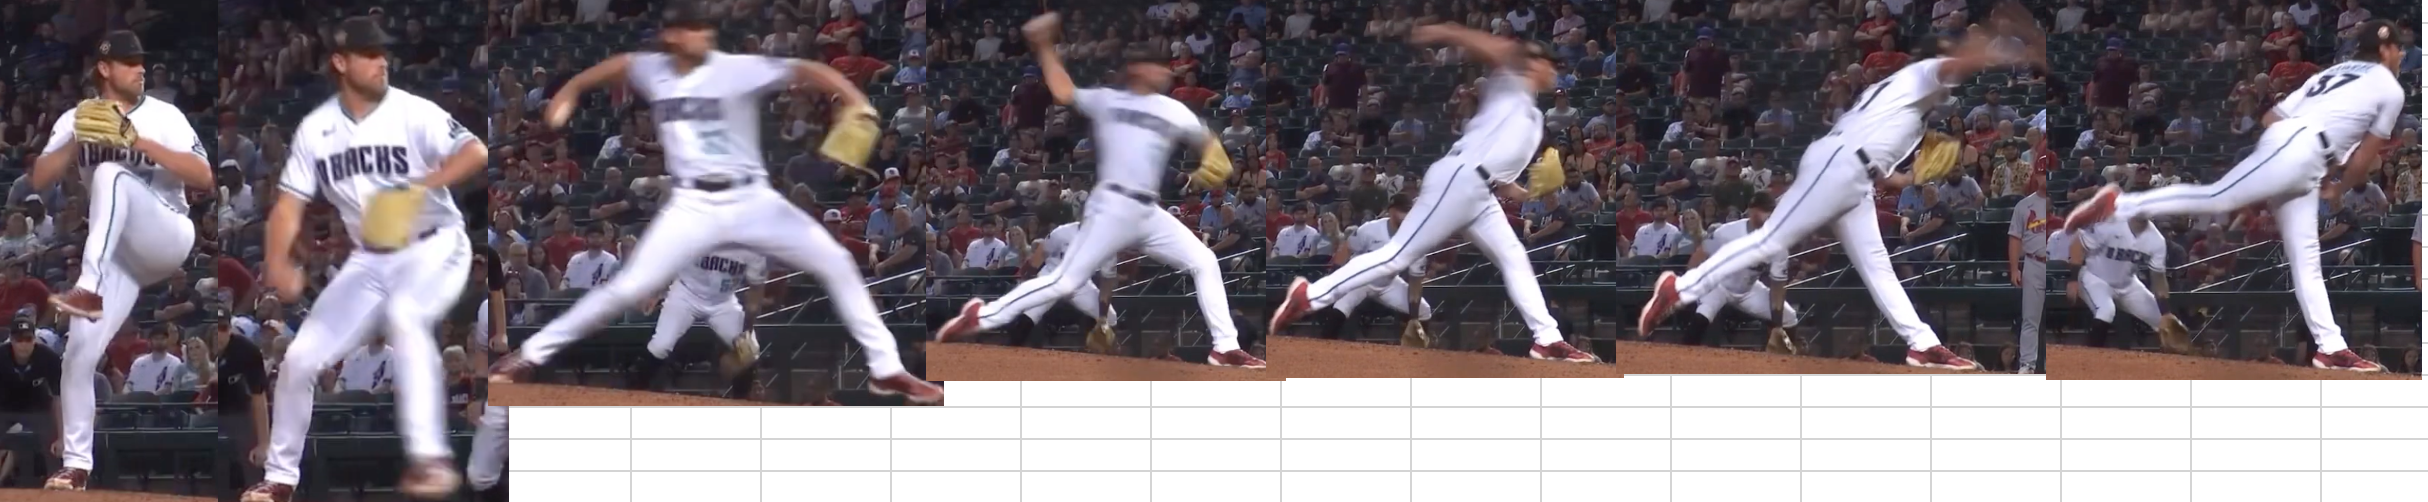
Let’s use Kevin Ginkle as an example.

Peak Knee Lift: This one is simple.  Take a screenshot when that lead leg has stopped moving upwards.

Drive Phase: When the front foot just starts to get ahead of the front hip.

Max Lead Leg Distance: Once the front foot has reached its max distance going towards home plate while the foot is still in the air.  Just prior to front foot contact.

Front Foot Contact: At or slightly after the front foot touches the ground and bears some body weight.

Max External Rotation: Since the arm moves so fast it will be difficult to determine the exact point in time that the shoulder reaches its max external rotation.  In fact, the arm will look like a blur.  Just do your best to finding the frame when the arm has stopped rotating externally before it bounces back to internal rotation.

Ball Release: Another one that is hard to capture the exact milli-second of when you stop touching the ball.  Again, do your best.

Follow Through: When the throwing arm reaches its max follow-through (internal rotation) before it recoils

Arrange these pictures going left to right for a righty or right to left for a lefty.

The finished product looks like this:

What are the limitations of a Kinogram?

Looking at still pictures has two obvious limitations

  1. Timing/Rhythm/Tempo
  2. Two-Dimensional Analysis

#1 . The timing or rhythm or tempo of the delivery is vital.  How we flow from one position to another is key.

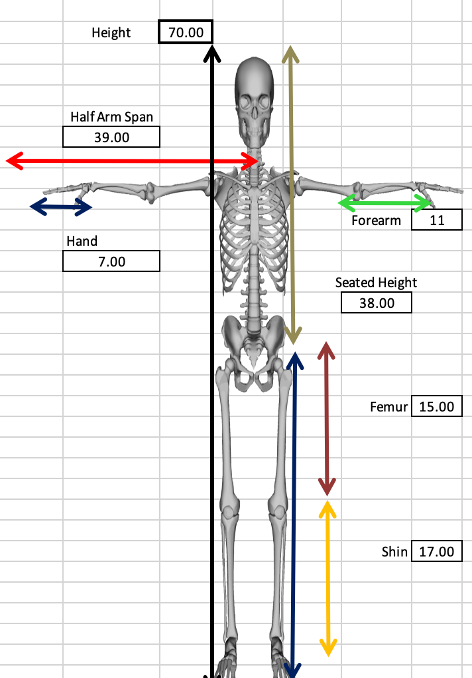
One way you can combat this is with a timestamp.  In this graphic below we see a skeleton kinogram of a volleyball approach jump.  The timing between the last two steps has to be quick in order to maximize the stretch shortening cycle to optimize jump height.  This time-stamped kinogram provides us with the data that the time between the last two steps (#3&4) is only 0.04 seconds.  Whereas the time between the 1st and 2nd step is 0.23 seconds (picutres #1 & 3).  If we only looked at “normal” kinogram we wouldn’t have any idea of the tempo they are using.  

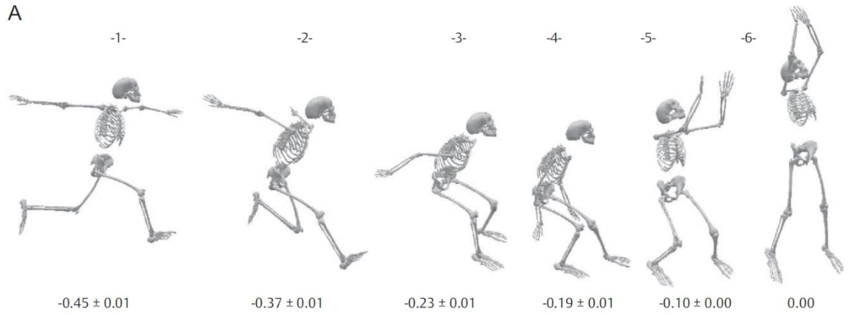
This obviously requires a step up in terms of technology but it can be solved. Counting the frames between each picutre is a great option.

#2 – Using a two-dimensional tool to solve a problem that exists in all three planes has its obvious limitations.  To solve this problem we can make another kinogram taken from a different angle.  Looking at a pitcher from the rear can provide a lot more information.  If we can pull out a step ladder and get an aerial view then we are really cooking.  Sync those cameras up and you’ve got yourself a comprehensive 3-D model of your pitcher.  This of course requires some more set-up and technology but again nothing too extreme or expensive.

Wrap Up

Kinograms are awesome because they work on the same level as our brain. Shapes are easy to see and understand providing a ton of information while not overwhelming young athletes.

Their simplicity is another key factor. You don’t need any expensive equipment or tech-skills. The fact that a teenage kid can do this on their own is amazing. The act of building their own kinogram will give them a much better understanding of their own mechanics. Future kinograms can be stacked on top of one another to see what progress has been made.

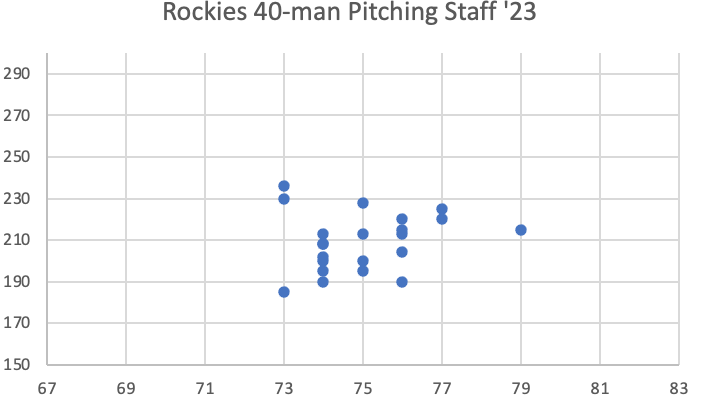
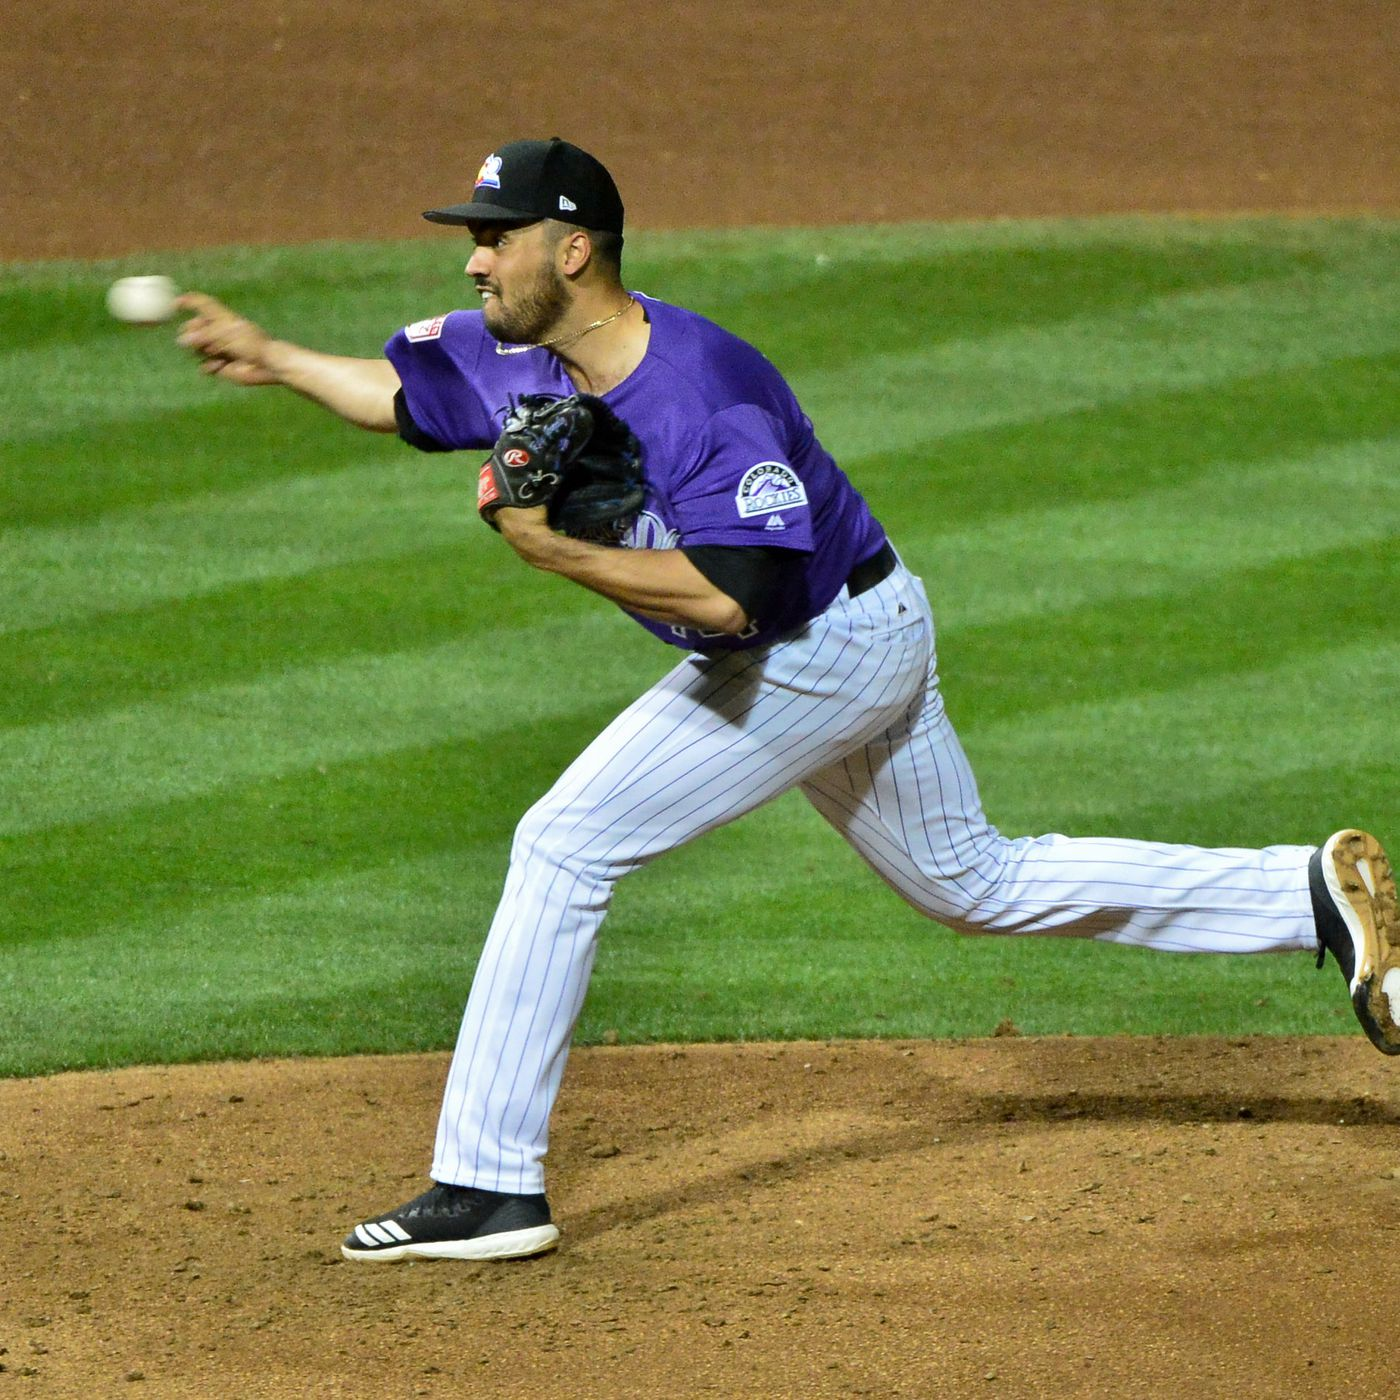
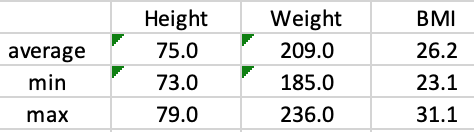
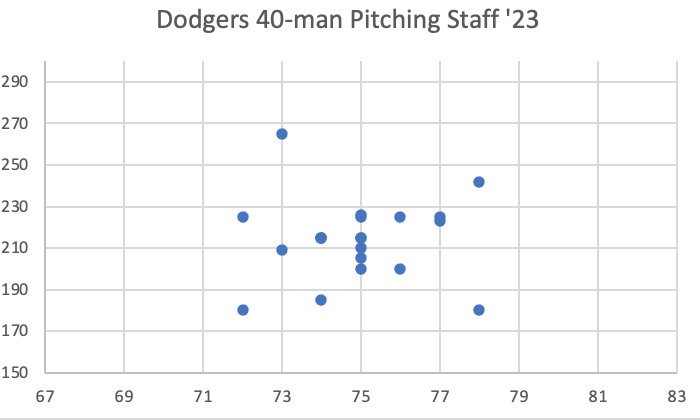
I hope that you found this information to be useful. Be on the lookout for Kinogram’s of different MLB pitchers of all sorts of shapes and sizes.

Thanks,

Graeme Lehman, MSc, CSCS

Million Dollar Arm 2.0 – Part 2 (Testing for Mobility and Phyiscal Abilites)

In case you missed it, here is a link to part 1, where I explain why we might want to look for pitcher’s outside of the baseball world. Part 1 also looked at the antropometric assessment that I think would be valuble.

Mobility

Some of the hardest throwers in the world use extreme ranges of motion.  They use this extra time that their mobility allows them to ramp up the speed needed to light up a radar gun.  The goal here is to get an idea of how mobile an athlete is in certain positions that are critical to an effective delivery.

Here are the important, repeatable, and quick mobility assessments that I would use:

  1. Shoulder External Rotation:  This measurement has to be assessed.  The ability to lay the arm back is vital to develop speed. 

The thing that I don’t like about testing shoulder ER is how in accurate it is.  The scores you get from person to person will differ on the way that the test is implemented.

A simple fist-to-fist test might be good enough here to see if someone has enough external rotation to at least get started. 

  • Field goal pose: This stretch across the pec can give pitchers a lot of time to create power.  Here’s a great example of what I am talking about from Aroldis Chapman.

The static version of this test has the athlete stand in a goal post pose.  Shoulders and elbows at 90 degrees.  Then you ask them to pinch their shoulder blades to see how much horizontal abduction they can produce.  Ideally, we can see some space between their vertical forearms and their head.  Try to cue them to keep their abs slight braced so that we don’t get too much low back activation.

3. Seated Rotation: Here we get a static assessment of their ability to dissociate their hips and trunk.  In a seated position with something like a soccer ball or foam roller between their knees we simply see how far they can rotate their upper body while the lower body stays completely still.

Figure 3 Credit – IFAST

4. Standing Splits: How are apart can an athlete walk their feet apart in the frontal plane while keeping their hands on their hips.  The ability to abduct the legs is important for pitching.  Not everyone needs to have a huge stride length but it’s nice not to be restricted by mobility.  The score of this test can and should be normalized based on their leg length.  Someone with long legs can have a high absolute score but still have poor adductor mobility.

Physical/Athletic Abilities

Here’s where we look under the hood.  The anthropometrics and mobility give us a sense of the athlete’s frame and what kind of positions they can achieve while these athletic tests give us an idea of how much power they can express.

Based on the same criteria (important, repeatable, and quick) here are the athletic tests that I would use to assess an athlete’s physical ability to throw hard

1.Broad jump: This test is the best because it’s so simple.  Everyone has tried it before and there’s no way to cheat it.  The result of one this one test can provide us with a couple of cool metrics that can give us more insight.

  • Relative Jump Distance to standing height
  • Absolute Power: take body weight into consideration and calculate power

Here’s an example of how this might look.  This athlete had the 8th best jump on the team but when it came to power, he ranked 5th.

2. Short Sprint:  Tremblay et al. found that a 10-meter dash was the best predictor of throwing velocity for U15 group.  This would require electronic gate timers for an accurate measurement.  If I didn’t have gate timers, I’d pick a 30-meter dash.  It’s long enough that we don’t need gate timers and its short enough that we are only focusing on the athlete’s ability to accelerate.

This simple equation can add some valuable insight to how much momentum, in the form of kinetic energy, each athlete can produce.  Throwing is all about transferring momentum from the body to the ball.  How efficiently this momentum is transferred what mechanics are all about.  But if the body can’t produce momentum in the first place it doesn’t matter how efficiently its transferred.

Here’s what it would look like on a printout sheet for the athlete and coach

Here we see a big athlete run one of the slower times on the team but since he was one of the heaviest, he shot to the top of the list in the power category.

3.Grip Strength: In the same Trembly study, grip strength was the best predictor of throwing velocity for both the U11 and U13 age groups. 

To me, this is the simplest and safest way to get an idea of how strong someone is.  If we can test the grip with the arm in different positions we can screen for potential injuries.  Testing at 90/90 and “Lay-Back”.

4. Lateral Jump: The #1 predictor of throwing velocity from my own thesis.  It does take a couple of tries to figure it out for some athletes but it’s pretty simple.  Here I am over ten years ago demonstrating it.  https://www.youtube.com/watch?v=e2WreUSXvbU

5. Backwards Med Ball Throw: The #2 predictor of throwing velocity from my study.  This one also requires a bit of a learning curve.  Figuring out the optimal time to release the ball is vital in getting an accurate score.  Letting go of the ball too soon or too late will reduce their result even if they are producing a lot of power.

It acts as a bit of screen in regards to their coordination.  If they can’t figure out when to release a medicine ball with two hands while moving at a moderate speed, they are going to have a real tough time figuring out when to release a baseball from one hand moving at incredibly fast speeds.

I like a 6 lbs ball and as reference Nate Pearson can launch it 73.5 feet!!!

Throwing

We of course have to see them throw.   Establishing their current “level” of throwing is crucial.  Throwing is tough to quantify making it harder to measure.  Due to its speed, complexity, and variety.

Of course, we can use our coach’s eye.  If you’ve been around the game for a long time, we just know good throwing when you see it.  However, two coaches will often disagree.

In this hypothetical situation that I’m describing I think using these defined levels of throwing ability presented by Southard et al 1998 would do the trick:

  1. exhibited simple arm and elbow ex-tension with little or no segmental lag.
  2. displayed a lag of the hand relative to the forearm but no lag of the fore- arm relative to the upper arm.
  3. displayed segmental lag of the forearm and hand with little or no lag of the upper arm relative to the trunk. Throwers placed in the highest level,
  4. displayed segmental lag of the upper arm relative to trunk, forearm relative to upper arm, and hand relative to forearm.

Segmental lag is the distal segment lagging in time and displacement behind its proximal neighbor.   In the study, segmental lag was determined by the relative time to peak velocity for each segment. 

While this system is still somewhat subjective it at least provides a framework that provides more context.

What’s Next

If you can gather all that information, you can then start to make educated decisions and a better plan about who has potential and how you can help them realize that potential.  That will be in part 2

References

https://sportforlife.ca/wp-content/uploads/2016/11/the-role-of-monitoring-growth-in-dlta.pdf

Mathieu Tremblay, Charles Tétreau, Laurie-Ann Corbin-Berrigan and Martin Descarreaux* (2022) Anthropometrics, Athletic Abilities and Perceptual-Cognitive Skills Associated With Baseball Pitching Velocity in Young Athletes Aged Between 10 and 22 Years Old.  Front Sports Act Living. 2022 Mar 29:4:822454.  doi:10.3389/fspor.2022.822454.

Ross, W. D., Marfell-Jones, M. J. (1991). Kinanthropometry. In J. D. MacDougall, H. A.

Wenger & H. J. Green (Eds.), Physiological testing of the High Performance Athlete (2nd ed.) (pp. 223-308). Champaign, IL: Human Kinetics.

Graeme Lehman 1, Eric J Drinkwater, David G Behm.  Correlation of throwing velocity to the results of lower-body field tests in male college baseball players. J Strength Cond Res. . 2013 Apr;27(4):902-8. doi: 10.1519/JSC.0b013e3182606c79.

Roach, N.T., Venkadesan, M., Rainbow, M.J., Lieberman, D.E. 2013. Elastic energy storage in the shoulder and the evolution of high-speed throwing in Homo. Nature. 498. 483-486.

Million Dollar Arm 2.0 – Scouting Pitchers Outside of the Baseball World

The movie “Million Dollar Arm” was a feel-good story centered around a sports agent trying to find pitching talent in a country where baseball is barely played at all in an attempt to find “a diamond in the rough”.  While watching, I couldn’t help but devise a set of tests and assessments that could have helped do a better job of identifying potential talent when it comes to throwing a baseball really, really hard.

The types of assessments that I am proposing would not make for good entertainment to the general population and would inevitably be cut from the movie.  But if you’re reading this article these nerdy details appeal to you.  So, unlike the movie where they only assess throwing, I am going to look at 3 additional yet important categories and tease out some important physical traits that are important to success on the mound.

  1. Anthropometrics
  2. Mobility
  3. Athletic ability

Before we dive into these categories let’s first explore the reason why we would want to look for throwers who don’t actually play baseball

Why Look for Throwers Outside of the Baseball World?

We want the biggest talent pool to draw from if we as the baseball world want the best of the best.  If we only look at athletes who currently play baseball our talent pool is shallow.  Since humans are designed to throw there’s potential to find premiere athletes who can launch a baseball out of their hand on every corner of this planet.

Looking overseas like they did in the “Million Dollar Arm” presents a lot of potential to deepen this talent pool.  We should however maximize what we have domestically by developing grassroots and scouting into other sporting domains.   While Baseball is immensely popular its numbers are dropping and not all of our best athletes are given baseball opportunities.

The high cost of travel baseball isn’t doing the sport any favors either when it comes to maximizing the number of participants.

Here are some situations where this might apply:

  • Rural areas: kids that don’t live in towns large enough to play baseball or requires them to travel great distances.
  • Inner City: kids that don’t have the chance to play baseball due to lack or teams or maybe the expense of travel teams won’t allow them to participate.
  • Athlete’s that Play other sports:  Kids often start playing whatever sport their friends play.

Personally, I have a lot of experience with this last category.  I live in Canada where hockey is very popular and they get the lion’s share of the best athletes. 

Hockey, like most sports now, is played year-round.  This hording of talent has adversely affected the number of athletes who would have been exposed to baseball during the summer past the age of 12 which seems to be when the switch to year-round hockey happens.

Figure 1 – If Tom Glavine grew up Canada today we might have missed out on this hall of famer

Non-Baseball ID Camps

Below you will find the things that I think would be valuable to measure in this type of situation. 

Here’s my criteria for selecting the tests and assessments

  1. Important
  2. Repeatable
  3. Quick & Easy

Anthropometrics

Let’s look at the frame of the athlete.  Certain body proportions and limb lengths aid in throwing a something light really fast (i.e., a 5 oz baseball). 

Let’s quickly look at some of the research done in this area.

Earlier I referenced the fact that humans are built to throw.  A study out of Harvard identified three distinct physical features that gives our species mechanical advantages to throw.  They are:

  1. Clavicle Width
  2. Long trunk
  3. Laterally facing shoulder joints

Here’s some research from other throwing sports as well:

  • Cricket: high correlations between ball release speed and shoulder-wrist length and ball release speed and total arm length in cricket bowlers. Glaizer (2000)
  • Water Polo: Taller, more muscular athletes with wider arm spans, broader humeri, and wider arms (relaxed and flexed) tended to throw with increased velocity.  Martinez (2015)
  • Water Polo: Biacromial breadth (shoulder width) shows a significate correlation to Throwing velocity. Ferragut et al (2011)
  • Team Handball: positive correlation of the height and arm span to the ball velocity is consistent with previous studies involving male and female handball players. (van den Tillaar, R 2004, Vila 2012, Zapartidis, 2009)

Cool information but these types of throws aren’t exactly like what we see when we throw a baseball.  In both water polo and handball, the feet aren’t even in contact with the ground while the throw is happening.

With cricket, the elbow has to be straight at ball release.  So, the shoulder to wrist measurement in the Glaizer study makes sense.

*By the way, I don’t think that looking for baseball pitchers in the cricket world worked since the rules of that sport requires that the pitchers, or bowlers as they call them, does not allow any bend in the elbow.  This takes external rotation, or lay-back, out of the equation.  The throwing actions while similar aren’t similar enough*

Baseball Anthropometric Study

I’ve had to rely on information from other throwing sports because there isn’t a ton when it comes to anthropometric studies focusing on baseball.  However, a recent study (Trembly et al.2022) did focus baseball players between the ages of 10 to 22.  They looked at the following measurements and investigated any links between the results and their throwing velocity.

  • Weight
  • Arm Span
  • BMI (body mass index)
  • Waist circumference
  • Upper arm length & girth
  • Forearm length & girth

Researchers only linked height as a positive predictor to throwing velocity for the athletes in the 16–17-year range. 

In this case all of the subjects played baseball.  So, we can’t say that none of these measurements aren’t important when it comes to velocity because, as a group, perhaps they all have long arms, for example, which is part of the natural selection process to play baseball. 

Based on this information, my own “gut”, and my criteria I listed, here is what I’d measure

  1. Standing Height
  2. Seated Height
  3. Half Arm Span
  4. Forearm Length
  5. Hand Size
  6. Shin Length
  7. Body Weight

From here I can get an overall idea of the athlete’s size and proportions.  Here’s an example of what I produce with my pitcher’s physical profiling system

Size Now vs Size Future

This kind of information is even more valuable when we are trying to scout young athletes.  The ratio of certain body proportion can give us clues about how big this athlete may get in the future. 

The reason for this is that growth doesn’t happen uniformly across the body.  “Growth Spurts” begin with the feet and hands, followed by the legs, then the arms, and finally the trunk.  Even if we looked at the throwing arm, the more distal segments of the upper limb (hand and forearm) reach adult proportions before the upper arm (Jensen, 1986; Malina & Bouchard, 1991).

The seated to standing height ratio is the most commonly used assessment to estimate where an athlete is in their develop journey, or, how old they are biologically.  An athlete’s biological age can differ from their chronological age by up three years, plus-or-minus.

“A child with a chronological age of 12 years may possess a biological age of between 9 and 15 years” (Borms, 1986)

Figure 2: These 3 athletes are the same chronological age

If a kid looks to have pretty long legs relative to their overall height, then they have more growing.

The Cormic Index

The immature or biologically young athlete would be considered “brachycormic” on the Cormic Index which classifies people, mature and immature, based on their seated to standing height ratio.  If your ratio is more less than 51%, you’d be called Brachycormic.  If you fall between 51 & 53%, you’re a metricormic while those who are more than 53% are labelled at macrocormic.

I bring this up to stress that just because a young athlete has long legs now (brachycormic) doesn’t mean that they will grow out of it.  Different populations tend to fall within certain portions of the Cormic index. 

Africans have a tend to have long legs and are thus more likely to be brachycormic with a ratio of 0.51.  Contrast this with Asian populations who typically considered macrocormic at 0.53 to 0.54 (Pheasant 1986).  Obviously, there are huge variety within each segment of the population but it’s still worth considering in my opinion.

**Getting a look at an athletes fully grown family members can also be valuable – its even better is they are fast twitch type athletes – I guess I will have to add an assessment for the parents too!!**

That’s it for now. In part 2, I will explore the assessment of both mobility and physcial/athletic abilites.

Thanks for reading!!!

Graeme Lehman, MSc, CSCS

Bigger Arms = Bigger Velocity?!?!?!

Bigger biceps and triceps can increase throwing velocity!!!!

If this isn’t a headline that grabs the attention of every young baseball player then I don’t what would.  This isn’t even an attempt to create some clickbait on my end either.  There’s some peer-reviewed research that suggests that bigger arms, bi’s and tri’s, can help improve throwing velocity. 

Here are some research headlines:

  • Southard et al. (1998) reported a 15% increase in hand speed when 1.4 kg was added to the upper arm
  • Linthorne et al. (2020) saw upwards of a 7% increase in throwing distance with javelin throwers
  • Fasbender et al (2020) reported that an increase in weight of the upper arm increased velocity while weight added to the forearm decreased throwing velocity.

Before we go putting a preacher curl bench in the bullpen let’s dig into the details so we can make some educated decisions.

The Whip Effect

The theory that bigger arms, upper arms to be specific, centers on the concept that the arm functions similarly to a “whip” during the throwing motion. What makes a whip effective in creating velocity is that it is heaviest at the handle and lightest at the tip. This gradient in mass, decreasing from proximal (near the body) to distal (toward the end of the arm), plays a crucial role in achieving the highest attainable velocities.

This “whip” analogy is compelling because of its universal visual appeal and, more importantly, its accurate reflection of the arm’s dynamic in motion.

The whip-like action materializes when the larger and more proximal part of the chain—specifically, the upper arm—decelerates, transferring its angular momentum to the lighter, distal segment composed of the forearm and hand, thereby leading to an increase in velocity.

Whip-like coordination is also used in kicking movements, and the mass difference between the thigh and shank segments is believed to enhance the kicking action.

The Leg Whip

This leads us to the question of what is the ideal shape of the arm if we are concerned with creating elite levels of throwing velocity.

On average, the upper arm is 75% bigger than the forearm segment (6,7).  But is this an ideal ratio?  What would happen if you messed around with this ratio and placed more weight on either the distal (forearm) or proximal (upper-arm) portion of the arm. 

This leads us back to those three studies that I referenced earlier.

Studies

Our first study, Fasbender et al (2020), found that an increase in upper arm mass would increase velocity.  The weight of the upper had to be around 5-6 kg.  This is a lot; the average human arm is only around 2.1 kg.  So, this seems unrealistic so maybe not so useful to us in the baseball world.

Here’s what you need to look like according to this study

The type of throw they used however looks nothing like what we see on a mound.  The subject was attached to a chair and was only able to access the sagittal plane.  Imagine a one-handed soccer throw-in with a tennis ball while being strapped into a seat.

They had to restrict the throw like this to truly determine how the mass of the upper and lower segments of the arm contribute to throwing velocity.  When the arm moves like this it is called a “double pendulum” and a lot of other sporting movements like soccer kicks, golf swings, and baseball swings have been analyzed like this using computer models.

Credit: Ryan McGinnis (Golf Club Deflection Characteristics as a Function of the Swing Hub Path)

Our second study, Linthorne et al. (2020), used real-life throwing. These researchers recruited 3 decathletes for this study and examined the differences in their javelin throw with different amounts of weight attached to the middle of the upper arm ranging from 0 to 3.3 lbs.

This study was conducted inside using a javelin ball (800 g/28 oz) and the participants were restricted to a short run-up. 

Now you know what a javelin ball looks like!!

The throwing distance was calculated by ball velocity which was determined by the distance the ball traveled in the 10 frames after ball release using a high-speed camera. Release height and release angle were very similar across all throws with the various weights.

The optimal weight for two of the participants was 21 and 7 ounces which increased their performance compared to their throws with no additional load by 7 and 4% respectively.  These subjects are high-level throwers already so an improvement like this is the difference between winning and losing.

The other participant had their best throw with no added mass.  Maybe this athlete already had an optimal ratio of lower to upper arm mass or maybe the added mass negatively alerted their throw.  Surely adding extra weight to your arm affects biomechanics.

How the added mass changes throwing mechanics was the aim of our final study.  The one that reported a 15% increase in velocity when mass was added to the upper arm.

This study, Mass and Velocity: Control Parameters for Throwing Patterns by Southard in 1998, looked at how throwing mechanics with a 4 oz ball differed with:

  • varying levels of intensity (25,50,75, and 100%)
  • subjects with different levels of throwing efficiency
  • load added to the arm at either the
    • distal (forearm)
    • proximal (upper arm)

This was a pretty cool study; its primary focus was to explore motor control seeing if the different weight distributions along the arm changed the actual throwing mechanics.  I’m going to try and focus on that portion of this study in a future article.  Right now, we are interested more interested in how velocity was affected.

Here’s a quote from their summary:

“Interestingly, the increase of mass to only the most proximal segment (upper arm) resulted in an increase in the velocity of the hand across levels of throw. This is not surprising, because an increase in the mass of the humerus would require a greater increase in the velocity of the more distal segments to maintain angular momentum.”

That last term “maintain angular momentum” basically means that once something is moving it wants to keep moving unless there are forces that will slow it down.  In this case, having a forearm that is too heavy would be a force that would reduce angular momentum.  Here’s another statement they made that supports this.

“Adding mass to the more distal segments would have the opposite effect of adding mass to the proximal segments. The increase in proportionate mass of the distal segment would not promote segmental lag, because attempts to conserve angular momentum would not increase velocity of the equally massive distal segment”

He could throw a mean punch but a weak fastball

What they are saying here is that if the forearm is too massive there can’t be that slight delay, or lag, between when the upper arm and forearm reach their respective peak velocities.  Pitching is a series of segmental lags.  The lag between your hips and shoulders rotating, the lag between your shoulder and upper arm, and in this case, the lag between the upper arm and forearm. 

Conclusion

So, before we start strapping weighted bands to the upper arms of our pitchers or making them do hour-long arm workouts every day, let’s remember what we learned from these studies

  • One study used a 4 oz with various levels of throwers.
  • One study used a 28 oz javelin ball with a running start
  • One study used a tennis ball with a sagittal plane type of throw while seated.

None of these are specific enough to baseball for us to say that this works.  That being said, it is intriguing and that’s the first step to answering new questions like:

  • What’s the ideal forearm-to-upper-arm ratio?
  • Maybe forearms that are too heavy make you a candidate for a Tommy John surgery.
  • Would using added mass to the arm help develop throwing velocity due to an overload
  • Would adding mass to the forearm help increase layback and change throwing mechanics for the better

Who knows?

I’ll follow this article up with another piece where I explore some ideas about this concept.

Thanks for reading,

Graeme Lehman, MSc, CSCS

References

  1. Mass and Velocity: Control Parameters for Throwing Patterns. Dan Southard. Research Quarterly for Exercise and Sport ©1998 by the American Alliance for Health, Physical Education, Recreation and Dance Vol. 69, No.4, pp.355-367
  2. Attaching mass to the upper arm can increase throw distance in a modified javelin throw.  NICHOLAS LINTHORNE, MARTIN HEYS, TOMAS REYNOLDS, NILS ECKARDT. Article in Acta of Bioengineering and Biomechanics · June 2020
  3. Optimal mass of the arm segments in throwing: A two-dimensional computer simulation study, Patrick Fasbender, Thomas J. Korff, Vassilios B. Baltzopoulos & Nicholas P. Linthorne (2020): European Journal of Sport Science, DOI: 10.1080/17461391.2020.1730446
  4. The Science of Soccer, WESSON J.,  Institute of Physics Publishing, 2002. (Hirashima, Yamane, Nakamura, & Ohtsuki, 2008).
  5. de Leva, P. (1996). Adjustments to Zatsiorsky-Seluyanov’s segment inertia parameters. Journal of Biomechanics, 29(9), 1223–1230.
  6. Winter, D. A. (2009). Biomechanics and motor control of human movement (4th ed.). New York, NY: John Wiley.

Pitcher’s in the NL West -Average Joes

Arizona Diamondbacks

Bryce Jarvis is a great example of the average D-Backs pitcher at 6’2″ and 195 lbs

Colorado Rockies

Justin Lawerance at 6’3″ and 213 lbs is right in the middle of this tightly packed cluster of pitchers.

Los Angeles Dodgers

Ryan Pepiot is 6’3″ and 215 lbs. Just slightly heavier and taller than the average.

San Diego Padres

Scott Barlow is 6’3″ and 210 lbs and best represents this team average.

San Fransico Giants

Kyle Harrison and Ryan Walker are both 6’2″ and 200 lbs on the left and right sides respectively. They are somewhere in the middle of this scatter plot.