Anyone who’s pitched knows the feeling: some days, the fastball is blazing, coming out hot and on point. Other days, no matter what you do, it feels like your heater has turned lukewarm. Despite your best efforts to adjust, those sluggish mechanics can creep in, leaving you scratching your head.
Coaches and teammates often chime in with advice about why your velocity is down. But without hard data, most of these suggestions are just educated guesses.
This study set out to investigate exactly that variability in fastball velocity. Researchers examined the mechanics of 82 SEC pitchers during games played at Auburn University and the University of Arkansas. Both stadiums are equipped with Kinetrax markerless motion-capture systems, which tracked the angular velocities of four key segments:
- Pelvis
- Trunk
- Elbow
- Shoulder
Every pitcher had the mechanics of their best and worst fastballs analyzed. This comparison of 82 “good” fastballs and 82 “bad” fastballs revealed differences in angular velocities at specific points in the delivery, highlighting key distinctions between the two types of mechanics.
As expected, the study confirmed that “differences exist in time-series angular velocities when comparing the fastest and slowest fastballs.” In simpler terms, faster-moving segments result in higher throwing velocities. This isn’t a big surprise.
However, the study’s true insight lies in the timing. For each joint or segment (pelvis, trunk, shoulder, elbow), only brief windows in the throwing motion show significant differences in angular velocity between fast and slow fastballs. This tells us something about the sequence or pattern that we want to see. And since we get to see the speeds each segment hits, we can gain insight as to the power and rhythm these pitchers can produce.
Pattern and Rhythm are a huge part of this great quote/concept from Altis, sprint specialist’s, that I’m infatuated with:

Previously I focused on the shapes that SEC pitchers made at key parts of the delivery that you can check out here. Today I’ll be focusing on the RHYTHM or PATTERNS of these high level pitchers.
Let’s take a quick peak to learn about the group of pitcher’s used in this study
Profile of the Subjects/Pitchers
- Average height: 6’2.5”
- Average weight: 205 lbs
- Average “fast” fastball velocity: 92.6 mph (peak: 99 mph)
- Average “slow” fastball velocity: 87.9 mph (low: 77 mph)
- Exclusions: No data was included from sidearm or submarine-style pitchers.
This “average” profile is very similar to the the article I just mentioned at the MLB in 2023.
To help illustrate these actions, I broke down a clip of Ben Joyce, the hardest thrower in SEC history and a former University of Tennessee Volunteer. I created a series of short GIFs for clarity. The first GIF, shown below, is the longest as it captures the entire pitch cycle. The others focus on individual segments or joints. Hopefully, watching them repeatedly won’t leave you feeling dizzy!

Let’s look at each one starting proximally and making our way up the kinetic chain.
Pelvic Rotation
The first of four charts focuses on pelvic rotation. It illustrates whether—and when—angular velocity differs between fast and slow mechanics. In this context, the vertical axis measures how quickly the pelvis rotates (in degrees per second) as it transitions 90 degrees toward home plate.

Pelvic Rotation Velocity (deg/sec)
The horizontal axis represents the percentage of the pitch cycle, with front foot contact defined as 0% and ball release at 100%. This method of defining the pitch cycle is widely used in research, as it provides clear, objective markers for the beginning and end. These landmarks help researchers pinpoint exactly where a pitcher’s movements occur within their delivery.
However, it’s important to recognize that critical elements of pitching happen outside the defined pitch cycle—both before and after front foot contact and ball release. This chart reinforces that point. The blue line being higher at the very start of the graph shows that when pitchers were “feelin’ it,” their pelvis was rotating more quickly even before their front foot hit the ground.
The data also reveals that pelvis rotation remained faster for roughly the first 30% of the pitch cycle during high-velocity fastballs. Recognizing the significance of these pre-pitch-cycle movements, the researchers went a step further. They re-analyzed the data by creating a new time frame. They looked at the 50 frames immediately before and after the moment the front foot contacted the ground which became the 0 and 100% points on this new time frame. Using this new time they found that the pelvis were moving faster between 31% and 52% points.

Trunk Rotation
The trunk is the next segment to reach its peak rotational velocity. The chart reveals that the trunk rotates slightly faster at the start of the pitch cycle, as indicated by the separation between the red (slow) and blue (fast) lines on the left side of the graph. However, the most significant difference occurs around the halfway point, where the “fast” mechanics exceed 1,000°/s.

Trunk Rotation Velocity (deg/sec)
This is likely when the stored energy from the much-coveted hip and shoulder separation is fully unleashed.
The timing here is critical. While most pitchers understand the importance of fast trunk rotation, those who can stay “sideways” with their upper body just a bit longer before unleashing their rotation may see significant velocity gains.

Watch the letter’s on his chest get stretched and spun towards home-plate.
Shoulder Rotation
This chart offers an intriguing insight. Toward the end of the pitch cycle, shoulder internal rotation velocity is significantly higher in “fast” mechanics compared to “slow” ones—an intuitive finding, as faster internal rotation correlates with higher throwing velocity.

Shoulder Rotation Velocity (deg/sec)
The authors reported a “significant difference” in shoulder internal rotation velocity during the 96% to 100% portion of the pitch cycle. To investigate further, they applied the same methodology used for the pelvis, analyzing the 50 frames immediately before and after ball release.

Their findings revealed heightened internal rotation velocity between 48% and 52% of the cycle, with the 50% mark aligning precisely with ball release. This indicates that the shoulder reaches its peak internal rotation speed at the moment the ball is let go—a logical result, as this rapid motion is crucial for generating higher velocity.
What’s fascinating, though, is the left side of the graph. Here, the blue line (fast mechanics) dips below the red, even going into negative values during the first half of the pitch cycle. This indicates that in fast mechanics, the shoulder rotates externally faster during this phase—also known as the “lay-back” position.
This position, where the shoulder reaches peak external rotation, is the foundation of the stretch-shortening cycle. Tissues like tendons and fascia, when rapidly and deeply loaded, respond with explosive force in the opposite direction. While the study didn’t measure range of motion, it clearly shows that faster external rotation enhances this elastic recoil effect.
Interestingly, this external rotation aligns with faster hip and trunk rotation, highlighting its passive nature. As the hips and trunk rotate toward home plate, the shoulder is essentially “whipped” into external rotation by the forces below, rather than actively rotated by the pitcher. This passive stretch, combined with the added load of the baseball in the hand, drives the shoulder into greater external rotation than could be achieved actively. This extra range creates the time and elasticity needed to generate the extreme speeds seen at ball release.

Elbow Extension
Here’s the chart demonstrating how fast and when the elbow joint is being extended. Unlike the other segments, which primarily rotate, the elbow functions more as a flexion-extension/hinge joint.

Elbow Extension Velocity (deg/sec)
The chart shows that differences in elbow extension velocity occur between 75% and 86% of the pitch cycle. Notably, the elbow reaches its peak velocity earlier than the shoulder—a finding that contrasts with the traditional kinematic sequence, where segments typically peak in a proximal-to-distal order:
- Pelvis
- Trunk
- Shoulder
- Elbow
In this study, however, the sequence was:
- Pelvis
- Trunk
- Elbow
- Shoulder
The researchers theorized that the early elbow extension serves a strategic purpose: lengthening the throwing arm. By doing so, the moment of inertia for shoulder internal rotation decreases, allowing the shoulder to rotate faster and translating into greater linear velocity for the throwing hand.

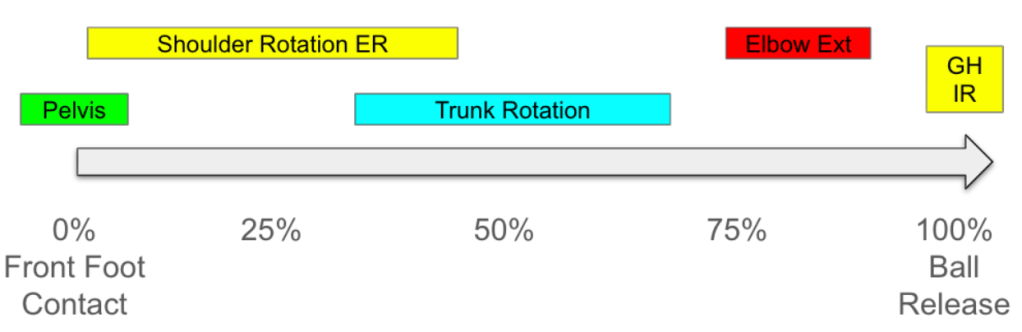
Sequencing
Now that we’ve looked at the pelvis, trunk, shoulder, and elbow individually in respect to how fast they are moving and when they are moving their fastest, let’s see how they all look together.

This graphic highlights when each segment is hitting its peak velocity, all of which by the way were considered to be “significant” between “slow” and “fast” mechanics.
This is the sequence that, on average, was used by these SEC pitchers. If you’re more of a numbers type of person here you go:
- Pelvis: 0-4%
- Trunk: 30-67%
- Shoulder Externtal Rotation: 3-50%
- Shoulder Internal Rotation: 96-100%
- Elbow Extension: 75-86%
My graphic above spills over either since the pelvis is moving faster before the front foot hits and there’s faster internal rotation for a split second after ball release.
Here’s the whole action one more time from Ben Joyce

This was an incredible study packed with valuable insights. The fact that it was conducted using real game data from elite pitchers makes the findings even more compelling.
I hope you’ve gained new knowledge and perhaps even sparked a few new questions to explore further.
Thanks,
Graeme Lehman, MSc, CSCS
Link to study:

Leave a reply to Jim Macarelli Cancel reply