The pitching world adores ratios. They put things into context and, in general, are better predictors of success.
Knowing that a pitcher gets lots of strikeouts doesn’t give you as much context as their K/BB ratio. This pitching ratio provides us with more information at a glance that we can use to make positive adjustments with our athletes.
The same is true in the sports science world and this study focuses on the use of ratios of different athletic assessments that were shown to correlate with throwing velocity.
Here’s the study:

This title got me excited in a very nerdy kind of way. For a while now I’ve been going down this rabbit hole of looking at how anthropometrics plays a role in throwing velocity for quite some time. Read this article to see what I mean.
Once I dove into the study, I quickly tamed my expectations because the only anthropometric data collected were height and weight. I was a little disappointed to see that this was all they measured. Every paper I’ve ever seen always reports height and weight. So, when I saw “anthropometric” in the title I was hoping for stats like arm span or seated-to-standing height and how they relate to throwing velocity. Maybe next time.
For the record, here are the “anthropometrics” of the 64 subjects in this study who were on average 24 years old trying out for a professional league in Taiwan.
On average, they were 5’9″ and 180 lbs
Here’s the list of the tests that they conducted during the tryout along with the average scores.
- Shoulder External Rotation (Throwing Shoulder)- 107.7 deg
- Shoulder Internal Rotation (Throwing Shoulder) – 52.5 deg
- 30-Yard Sprint – 4.05 sec
- 10-Yard Sprint – 1.82 sec
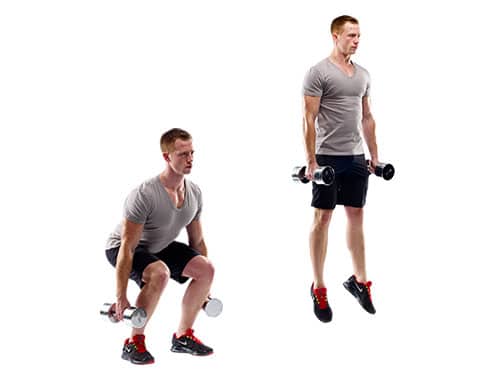
- Countermovement Jump (hands on hips) – 43 cm / 17 inches
- Loaded Countermovement Jump (10 kg DB in each hand) – 35.5 cm/ 14 inches
From this list, the only one that positively correlated to throwing velocity was height. It wasn’t until they looked at the ratio between a couple of tests that they found two more positive predictors of throwing velocity.
Here are the two ratios that positively correlated to throwing velocity
1- Positive CMJ Ratio: this meant that the height of the loaded jump was relatively close to the height of the unloaded CMJ. To find out your own CMJ Ratio divide your loaded jump by your unloaded jump.
2 -High Sprint Ratio: this meant that an athlete’s first 10 meters of a 30-meter dash were slower, relatively, compared to the last 20-meter from the 10 to the 30-meter marks. If you are lucky enough to have electronic gate timers, then divide your 0-10 Yard time by your 30-meter time.
So, in total there were 3 predictors of throwing velocity within this particular group.
- Height
- Positive CMJ Ratio
- High Sprint Ratio
Let’s take a closer look at each of these predictors
1. Height
In a lot of studies, height isn’t all positively correlated with throwing velocity. If it was, I think we would see more pitchers north of 6’6” on MLB mounds. I know that in the ’90s only 14% of pitchers in the MLB were over 6’4″.
Guys throw a lot harder now but the league average is 6’2″ which is tall but not too tall.
The average height in this study however was only 5’9″. So being on the tall end of this particular group of pitchers proved to be helpful in producing velocity. The researchers reasoned that the long limbs that come with being taller provide more time to accelerate and better leverage. This makes a lot of sense when looking at a shorter population. I just think this correlation between height and throwing velocity drops once we start getting closer to the 6-foot mark.

2. Positive Countermovement Jump Ratio:
This is where it gets interesting, it was determined that having a positive Jump Ratio was correlated to higher throwing velocities within this group.
What’s a positive jump ratio you ask?
Having a positive jump ratio meant that your loaded jump was reasonably high compared to the unloaded jump. Obviously jumping with extra weight in your hands is going to slow you down and not let you get as far away from the ground compared to when you’re unloaded. But if that difference isn’t very much, it means you have a positive jump ratio which tells us that you’re relatively strong. Part 2 of this series will go deeper into what these results mean and how we can use them.
Other research has shown that athletes with positive jump ratios like this could produce higher peak and instantaneous forces along with a faster Rate of Force Development (RFD). All good things if you’re interested in producing athletic power.
When the subjects jumped without weight, their hands were placed on their hips. This explains why the jump height was only about 17”. Without the arm swing, there is a lot less energy going into the ground and subsequently less force coming back. Go ahead and try jumping like this right now. I bet you feel pretty unathletic.
The reason they jumped like this was that the jump technique has to be similar to the loaded jump where everyone had to hold a 10kg (22 lbs) dumbbell in each hand. Holding weights like this doesn’t allow you to load with your arms. So, to compare apples-to-apples, so to speak, they had to restrict the arms with the unloaded jump.
This is a subject that I jumped into pretty heavily and if you want to learn more check out this chapter in my free e-book.
3. High Sprint Ratio
This test had the subjects perform one 30-meter sprint with a split time at the 10-meter mark,
If your time in your first 10 meters were slow compared to the last 20 meters then you would have more of a high sprint ratio.

When looking at the ratio between the 10- and 30-meter sprint times we are again able to take an educated guess as to how a particular athlete best produces force, as it relates to sprinting.
Those that have a fast 10-meter dash time relative to their 30 m dash time can be thought of as having more of a muscular-driven system. The really strong and muscular sprinters, for example, have great starts out of the blocks.

This is a picture of Su Bingtian who has some of the best starts in the world. He uses his muscular legs to dominate at the start of each race.
Whereas the athletes with a relatively slow initial 10 m dash compared to the rest of the 20 meters could be argued that they are more of an elastic and tendon dominant type athletes. These athletes would have a negative sprint ratio since their 10-meter time represents a higher portion of the overall sprint time.

Andre Degrassi
This information could again be used by the sport scientist/S&C coach in targeting their training time and effort towards these particular shortcomings.
This is what I am going to discuss in part 2 with a deep dive.
Stay Tuned
Graeme Lehman, MSc, CSCS

Leave a comment