In my opinion, sprints should always be a part of any baseball player’s program, even pitchers. Sprinting is the most primitive form of training and the forces and speed that it creates cannot be replicated in the gym.
The role of sprinting and how it relates to pitching will be today’s focus. The inspiration for this article came from this study. Check out these two pieces (Part 1 and Part 2 ) I’ve already written about this study.
What they found in this study was that a positive sprint ratio was linked to throwing velocity. Again, these were adult males around 26 years old at an open tryout for their professional league.
Having a positive sprint ratio meant that your initial 10-meter split time was slow compared to the final 20-meters of the 30-meter dash test. The first ten yards are considered to be “pure acceleration” while the rest of the test would fall under the “transitional acceleration” classification used in the sprinting world.
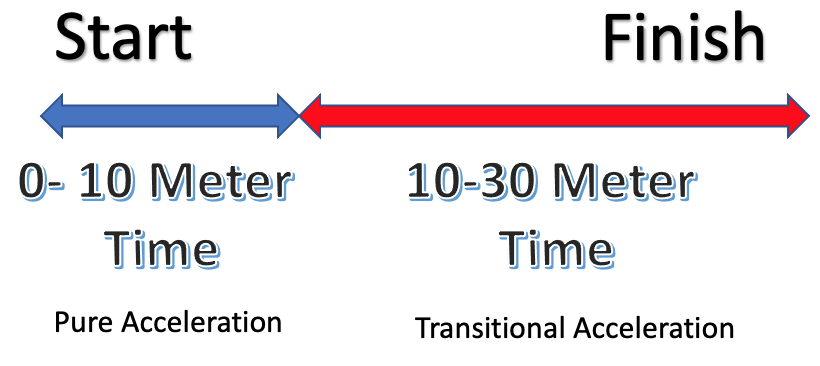
The sports scientist would look at these results and say that those who had a fast finish (aka positive sprint ratio) would be more velocity-driven type athletes. Whereas the athlete who is fast right out of the block would be more force driven with lots of muscular strength that’s needed to start the acceleration process from a dead start.
This is the opposite of what we saw with the jumping ratio. There, it was the more force-driven athletes who had lower decrements between an unloaded and loaded jump that had a positve link to throwing velocity.
What does this mean?
According to this study, the sprint speeds that you can achieve with a flying start are a better predictor than your speed for the first 10 meters. Here is how they worded it
“transitional acceleration is more important to pitching velocity than pure acceleration, “
This is one of the first times I’ve ever come across a study that linked throwing velocity to sprinting speeds. If you’ve been around baseball long enough you know that pitchers aren’t usually the fastest runners on the team.

This study only tested pitchers specifically. So if in fact, pitchers are slower than position players, then we are looking at who’s the fastest in the slow group which is useful information.
There’s not a lot out there in the research world exploring the link between sprinting and throwing velocity. I know that in the study I conducted, both 10-meter and 60-yard dash times were not correlated to throwing velocity.
There were a couple of studies with younger subjects that did have a positive correlation. One study (1) listed the 10-yard dash along with broad jump and grip strength as physical tests that correlated positively to throwing velocity. These subjects were between the ages of 7 and 15.
And this study (2) stated that out of a dozen or so physical tests, only the 10-meter dash time was linked to throwing velocity for the 15-year-old subjects. This study looked at baseball players ranging from 12-22 years old but it was only the 15-year-old group that demonstrated this link between sprinting and throwing.
Neither of these last two studies looked at different sprint distances like they did in this study so it’s hard to draw some conclusions. That being said here’s a potential explanation.
Why does it work?
The specificity of the contraction speed is what I feel has the most carryover. This was the same when I looked at the jump ratio except this time, I believe it’s specific to the front leg. The speed at which the front leg reaches its max ground reaction forces (GRF) roughly matches what we see in sprinting.
In a study in 2012 by Werner et al (4). they reported that the front leg reached its maximal vertical GRF about 45 milliseconds after the front foot hit the ground. This timeline is similar to what you see in sprinting. Below is a table from a study (3) that used two different models to predict the time it took to reach peak vertical GRF while sprinting. The “spring-mass” model has the exact same time to peak vertical GRF as the pitching study by Werner.
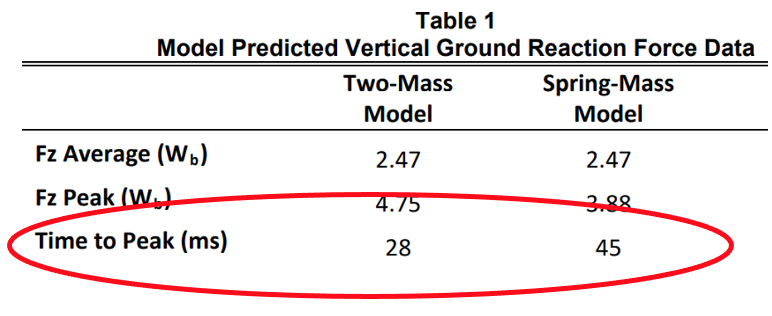
Models like this are needed to calculate GRF since we can’t measure sprinting on a force plate. You would need an entire track made out of force plates to get the real numbers.
So, sprinting, with a flying start, might be a good way to train the front leg for the speed and forces that it is going to encounter. Transitional acceleration is what we could call it and here’s where it sits on the force-velocity curve of sprinting drills. During the first 10-meters (aka pure acceleariton) these times would be slower.
How to test
The numbers recorded in the study were taken with electronic gate timers which is really the only way to accurately test short sprints like this. Stopwatches are much less expensive but you just can’t trust the data. And if you want to take splits like they did in this study then you have to embrace technology.
If you do have a set of gate timers then break them out a lot. The feedback the athlete gets is huge, just like when we are throwing. If you are timing your sprints on regular basis this becomes a case where testing is training are one and the same which gives you another variable to track your athletes with on a regular basis. To take it to the next level I’d calculate kinetic energy too just so we take body weight into consideration.
What to shoot for
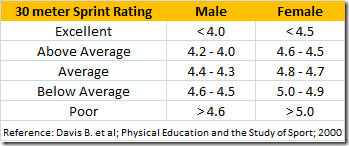
While looking at the ratios is cool and all we do have to pay attention to the raw numbers themselves. If an athlete’s positive sprint ratio is a result of a really slow start and less slow finish then we don’t need to make things more complicated. Start sprinting and get better. Be sure that your 10-meter time is less than 2 seconds and our 30-meter times are sub 4.6 before entraining the idea of looking into these ratios. The averages in this particular study were 1.82 and 4.05 seconds respectively.
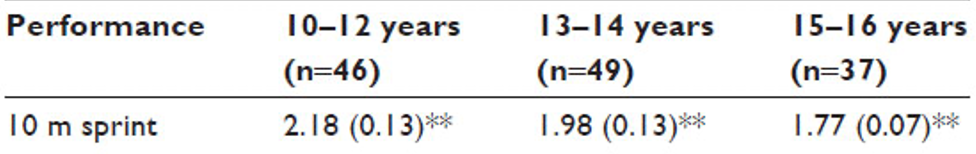
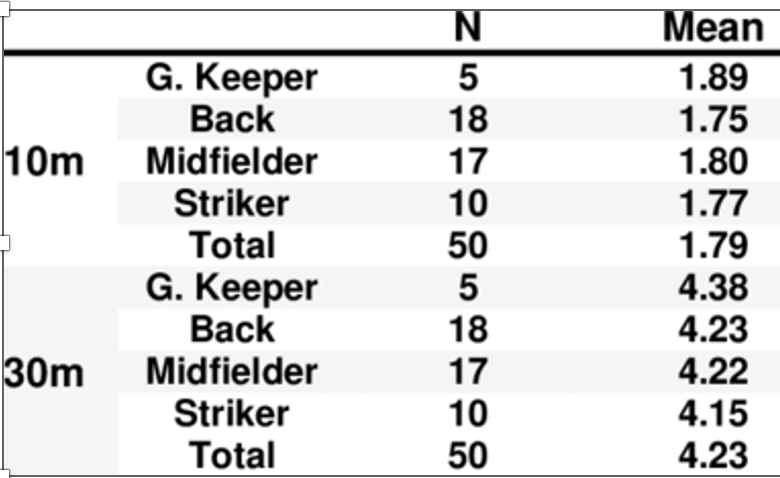
As a reference, I added some more sprinting norms for these particular distances and ages that you can check out below. These are mostly comprised of soccer players.
That’s it for this article. I’m going to tie up some loose ends in part 4 of this series.
Sincerely,
Graeme Lehman, MSc, CSCS
References
- RELATIONSHIP BETWEEN PERFORMANCE VARIABLES AND BASEBALL ABILITY IN YOUTH BASEBALL PLAYERS. HIROKI NAKATA, TOMOYUKI NAGAMI, TAKATOSHI HIGUCHI, KIWAKO SAKAMOTO, AND KAZUYUKI KANOSUE
- Anthropometrics, Athletic Abilities and Perceptual-Cognitive Skills Associated With Baseball Pitching Velocity in Young Athletes Aged Between 10 and 22 Years Old Mathieu Tremblay, Charles Tétreau, Laurie-Ann Corbin-Berrigan and Martin Descarreaux
- GROUND REACTION FORCES DURING COMPETITIVE TRACK EVENTS: A MOTION BASED ASSESSMENT METHOD Andrew Udofa , Laurence Ryan , Kenneth Clark , and Peter Weyand
- LOWER-EXTREMITY GROUND REACTION FORCES IN COLLEGIATE BASEBALL PITCHERS JOHN A. GUIDO, JR AND SHERRY L. WERNER
- Mangine GT, Hoffman JR, Frangala MS, Vazquez J, Krause MC, GillettJ and Pichardo N. Effects of age on anthropometric and physical performance measures in professional baseball players. Strength Cond Res. 2013 Feb; 27(2); 375-81

Leave a comment