The purpose of this article is to give young baseball players an idea of just how athletic they need to be in order to play professional baseball. While you might have heard about how big and strong major league players are, you don’t often hear how strong they were when they got drafted as teenagers. Use these numbers as a goal to work towards in the weight room and on the field.
How Fast and Strong do you need to be to grab their attention?
Below you will see how athletic profile of players of all between the ages of 16 and 19 in either Cincinnati Reds, Detroit Tigers, New York Mets, or Texas Rangers between 2005-2010. It’s even broken down into position players and pitchers. See below for the actual reference.
Perform these same tests and see how your performance ranks compared to these athletes that have reached the same goal you are trying to achieve.
Athletic Profile of Professional Position Players – Ages (16-19)
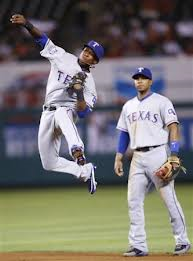
The very young and very athletic Jurickson Profar
| Athletic Profile of Professional Position Players Ages 16-19 | ||||
| Weight (lbs) | Weight (kg) | Lean Body Mass (kg) | %Body Fat | |
| Body Weight & Fat | 196.7 | 89.4 | 79.3 | 10.8 |
| Jump (inches) | Jump (cm) | Peak Power (watts) | Mean Avg (Watts) | |
| Vertical Jump | 27.2 | 69.0 | 10410.0 | 2128.0 |
| Time (sec) | Speed (m/s) | Kinetic Energy (J) | ||
| Pro-Agility | 4.45 | 4.11 | 754.3 | |
| Time (sec) | Speed (m/s) | Kinetic Energy (J) | ||
| 10 Yard Dash | 1.65 | 5.54 | 13171.6 | |
| Strength (kg) | Time | |||
| Grip Strength | 50.6 | 300 Yard Shuttle | 51.7 | |
Athletic Profile of Professional Pitchers Ages 16-19

The Powerful Homer Bailey – Drafted out of High School
| Athletic Profile of Professional Pitchers Ages 16-19 | ||||
| Weight (lbs) | Weight (kg) | Lean Body Mass (kg) | %Body Fat | |
| Body Weight & Fat | 201.3 | 91.5 | 80.6 | 11.7 |
| Jump (inches) | Jump (cm) | Peak Power (watts) | Mean Avg (Watts) | |
| Vertical Jump | 26.3 | 66.8 | 10342.0 | 2129.0 |
| Time (sec) | Speed (m/s) | Kinetic Energy (J) | ||
| Pro-Agility | 4.68 | 3.91 | 698.0 | |
| Strength (kg) | Time | |||
| Grip Strength | 50.5 | 300 Yard Shuttle | 51.6 | |
Below you will find out how to complete all of these tests to get your own numbers. Again us these numbers as a starting point and the numbers you see in these charts can serve as your goal.
Print these charts out and put them up in your gym to remind yourself of how hard you need to train in order to improve your physical tools in order to improve your chances of getting drafted as a teenager.
The Tests
Body Weight and Body Fat: stepping on a scale to see how heavy you are is easy enough but it would be nice to know how much of that weight is fat and how much of it is lean muscle mass. Having a lot of body weight is a good thing because it allows you to generate more energy which you can transfer into the ball when you throw or hit. But if that body weight is high because of fat you can’t generate the kind of speed needed to succeed in the game of baseball.
Try to find someone who is skilled in using body fat calipers. You can get them to measure your thigh, stomach, and chest for body fat then plug into the Jackson-Pollack 3 body fat formula which is the formula used in the study where I got these numbers.
10-Yard Dash: Due to the short amount of time and distance it does make it a bit harder to accurately time the 10-yard dash. If you have access to laser gate timers then go for it. If not use a stopwatch. If coaches can accurately measure a catcher’s pop time they can get a 10-yard dash time. If you’re wondering why a 10-yard dash and not a 60-yard dash then click here to read about why acceleration is so important.
By looking at the combination of your 10-yard dash time and your body weight we can easily figure out how much energy you are creating. Remember how I mentioned above how important body weight was in creating momentum? If you are big and can run well then you create a lot of energy that can be used with either a bat or ball in your hand. Pitchers for whatever reason didn’t perform the 10-yard dash.
To calculate your speed and the amount of energy you create follow these calculations
- To get Speed in terms of meters per second take the number 9.41 and divide it by your 10-yard dash time. (10 yards = 9.41 meters)
- Divide your body weight by 2.
- Take your speed number (step 1) and square it.
- Multiply the numbers you got from steps 2 and 3 together to get your final kinetic energy factor number in Joules.
To learn more about the importance of kinetic energy check out this article:
Pro-Agility: Again this test places an emphasis on a short burst of acceleration, 3 of them to be exact. The athlete must also show how well they can decelerate which takes a lot of strength and coordination. If we apply the same equation that we did for the ten-yard dash then we can get a reading on how much power is being produced with the momentum that each athlete creates based on their speed and mass. The only difference is that take the number 18.82 and have to divide the number of seconds it took you to complete the test.
Vertical Jump: Once you get your vertical jump score in centimeters we can plug that into a formula along with your body weight in kilograms to calculate the amount of power you produce. You will get two different scores both of which are measured in Watts which is a unit of power. The “Peak Power” score tells you how much power you created during the takeoff while the “Average Mean” score is how much power you averaged for the entire jump. They are different but both are important because they have been shown to predict power numbers for hitters such as home runs and slugging percentage.
To learn more about the importance of jumping power in baseball read this article:
Peak Power Equation = (61.9*cm)+(36*kg)+1822
Mean Average Power = (21.2*cm)+(23*kg)-1393
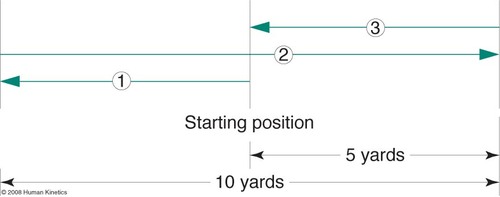
300-yard shuttle: Pretty easy to set up but not much fun to do. Set up two cones 25 yards apart. Run to one cone and then back to the first cone to complete one round of 50 yards. Repeat that five more times for a total of 6 in order to run 300 yards. Rest for 5 minutes then run it again. Take the average of the two as your score.
Hand Grip: For this test, you need to get your hands on a handgrip dynamometer.
The Study:
Mangine GT, Hoffman JR, Frangala MS, Vazquez J, Krause MC, GillettJ and Pichardo N. Effects of age on anthropometric and physical performance measures in professional baseball players. Strength Cond Res. 2013 Feb; 27(2); 375-81
Sincerely,
Graeme Lehman, MSc, CSCS

Leave a comment